Effort is estimated, not measured
The baseline comes from interviews, workshop averages and what people believe they spend their day on. It is the fastest way to get a number and the least defensible way to hold one.

Find where time, effort and operating cost are being lost, and quantify the opportunity before deciding what to change — activity by activity, in hours and FTE rather than percentages.
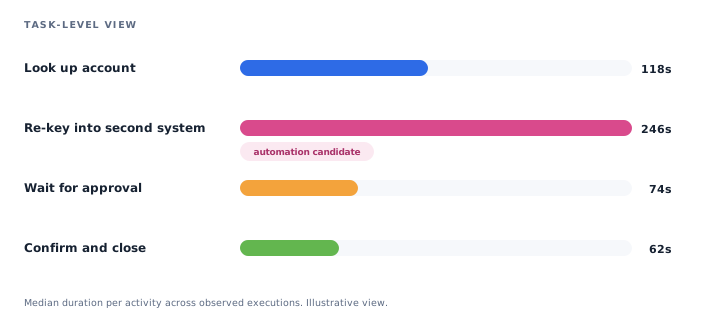
Illustrative view of measured activity time.
Most operating-cost programmes are not short of ideas. They are short of a number that survives contact with a finance partner.
The baseline comes from interviews, workshop averages and what people believe they spend their day on. It is the fastest way to get a number and the least defensible way to hold one.
Re-keying between systems, chasing an approval by email, the spreadsheet that was never meant to be permanent. None of it appears in a system log, and all of it consumes paid hours.
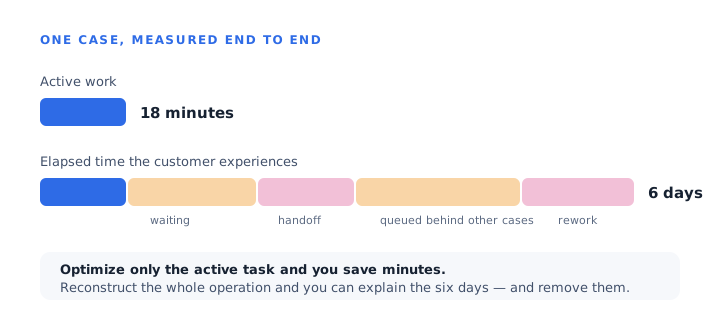
Elapsed time and active time are not the same number. Sizing a saving against elapsed time overstates the opportunity; ignoring the waiting hides where the cycle time actually goes.
Without a measured before-state there is no way to prove the improvement happened, which is why the second wave of a cost programme is always harder to fund than the first.
Value leakage is rarely one thing. These are two patterns measurement reliably surfaces — illustrative rather than an exhaustive model.
Paid hours consumed by work that produces nothing the customer values: re-keying the same data into a second system, chasing an approval by email, rebuilding a report by hand each month, correcting an error that an earlier step created.
A simple example. A servicing team re-enters customer details into a second system on every case. Four minutes, nine thousand times a year. That is six hundred hours — roughly a third of a full-time role — spent on a step nobody designed.
Capability you are already licensed for, sitting unused, while people do the work manually alongside it. The software cost is already sunk; the effort cost is being paid on top of it.
A simple example. The case management platform has a bulk-update function. Two of five teams use it. The other three do the same work case by case, because the person who knew about it moved on. Both the licence and the hours are being spent.
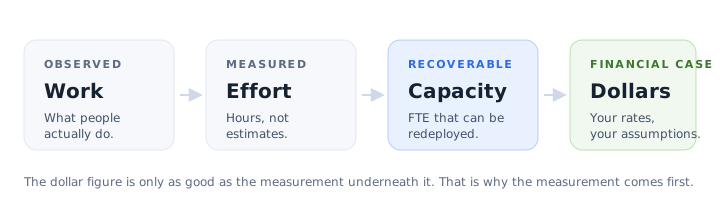
Discovery observes the work as it is performed across applications and teams, then measures it — so the cost case is built from what happened rather than from what people remember.
Stereologic reconstructs the end-to-end process first, then finds the repeating patterns inside it — the sequences that recur across cases, teams and sites. Each pattern carries how often it ran and how much total employee time it consumed, which is what makes ranking possible: a four-minute step performed nine thousand times is a bigger prize than a two-hour step performed twice.
From there the arithmetic is ordinary. Frequency multiplied by measured duration gives total effort; effort expressed in hours and FTE gives a number an operations lead and a finance partner can argue about on the same terms. Non-value-adding activity is separated out explicitly, and so is time spent waiting rather than working.
Process Mining answers where the work goes: how it moves end to end and where cases queue. Deep Task Mining answers what work was accomplished inside the applications, at activity level, including the interruptions that normally distort task timing. Cost work usually needs both.
The test of an operating-cost number is not whether it is large. It is whether someone can open it up six months later and still see where it came from.
Durations come from observed work rather than from interviews, so the baseline does not move when the person who gave the estimate leaves.
Any number can be drilled from process to activity to the actual screen behind it, which is what makes an internal audit review survivable.
Detected inefficiency is expressed as effort, so the business case rests on measured hours instead of a percentage with no denominator.
Observation runs with non-intrusive, no-install desktop-recording software and no Administrator-level endpoint access, and without asking anyone to change how they work.
A sized opportunity list is a decision aid, not a decision. Some items are automation candidates, some are standardization work, and some are a system or handoff problem that automation would only make faster.
Back-office customer management operations at Pitney Bowes. Figures are drawn from Stereologic’s published Pitney Bowes case study.
Pick the area you are being asked to take cost out of. Stereologic can measure how the work is really performed, separate the waiting from the working, and size each opportunity in hours and FTE before anyone commits to a change.