
Pitney Bowes: 30% lower operational cost in under 90 days.
Back-office customer management operations. Operational cost down 30%, customer service response 56% faster, servicing errors from 20% to zero — measured in under 90 days, and drawn from Stereologic’s published case study.
Cost had to come down, and service could not come down with it.
Customer satisfaction had become a key operational parameter at Pitney Bowes, and the company had spent several years working to reduce operational cost. The constraint that made this engagement different was time: the cost had to come out within a very short period, and service could not be allowed to degrade while it did.
Two problems had survived the improvement work already done. Customer Service was still missing its required SLA, and the error rate in servicing customers was above the acceptable level. Both had been worked on. Neither had moved.
- Reduce operating cost and improve customer satisfaction, in a very short period of time
- Customer Service continuing to miss the required SLA despite improvement effort already spent
- Error rates in servicing customers above the acceptable level
Company context
Pitney Bowes: $3.4B revenue, 14,700 employees. Company-scale context from the published case study — it describes the organization, not the scope of what was measured. The measured scope was back-office customer management operations. The same case study describes work observed across multiple remote locations, and the customer contact was the senior manager for North America call centre operations.
The gap between what agents were doing and what they were supposed to do.
The improvement effort had not failed for lack of will. It had been aimed without evidence, because nobody could see where the time and the errors actually were.
Stereologic observed operations across multiple remote locations with non-intrusive, no-install desktop-recording software and no Administrator-level endpoint access, and reconstructed employee processes, timings, deviations and inefficiencies from the work itself. That turned a general belief that the operation was inefficient into something specific: which group, which deviation, how much wasted time and where the errors were occurring.
The important shift was who could see it. Deviations, wasted time and errors were visualized per group, which put the evidence in front of the supervisors and subject-matter experts who manage the work day to day rather than in a report that arrived after the fact.
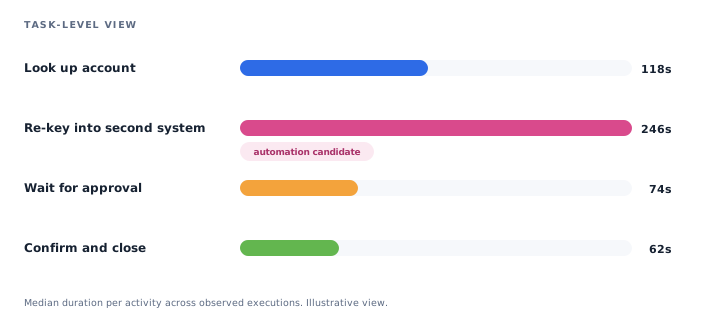
Illustrative view of the kind of task-level detail discovery produces — not Pitney Bowes data.
You want to have the tool like Stereologic in the hands of the supervisors and the subject matter experts that manage operations so that they could actually see — what the agents are doing vis-à-vis what they are supposed to be doing.
Ronnie MahabirSenior Manager, North America Call Centre Operations, Pitney BowesImprovement aimed at measured problems, and inspected as it went.
With deviations, wasted time and errors identified per group, the improvement programme could be pointed at specific work rather than at the operation in general — and it could move quickly, because the diagnosis no longer depended on manual observation studies or a data-extraction project.
Detection was continuous rather than periodic, so a deviation that reappeared was visible while it was happening and could be addressed by the supervisor who owned that group. The servicing errors were identified and addressed the same way, which is why the error figure in the outcome below is an elimination rather than a reduction.
What the published record does and does not contain
The case study records the actions at this level: continuous detection of deviations, wasted time and errors per group, and an accelerated process improvement strategy built on that evidence. It does not publish a step-by-step change log, and none is invented here.
Three verified numbers, with the scope they were measured in.
Back-office customer management operations at Pitney Bowes. Figures are drawn from Stereologic’s published Pitney Bowes case study.
A fourth published result
Above 65% NSAT for eight consecutive months. The published case study also records that Pitney Bowes sustained a net satisfaction score above 65% for eight consecutive months. It is recorded here separately from the three headline figures because it is a sustained-performance measure rather than a reduction against a starting position.
Third-party recognition
Pitney Bowes won the 2014 Process Excellence Award for “The Best Process Improvement Project under 90 days” — which is also where the timeframe above is corroborated.
Sources
The figures, the company context, the quotation and the award on this page are drawn from four published records:
- Stereologic’s published Pitney Bowes case study — the primary source for the narrative, the published results, the company context, the solution description, the Ronnie Mahabir quotation and the Process Excellence recognition.
- Ronnie Mahabir’s public video and webinar appearance as Senior Manager, North America Call Center Operations — customer-spoken evidence for the service, error, cost and operational-visibility context.
- The Process Excellence Network interview on the Pitney Bowes project, which identifies it as a PEX Network 2014 Project Award winner and covers the 56% acceleration and the 30% saving.
- Stereologic company history, which records the 2014 Process Excellence Award for Best Improvement Project under 90 days.
The published record contains other figures. Only the ones carrying a scope, a timeframe and a method appear here.
What the operation actually got.
Only what applies to this case. Stereologic produces other artifacts — generated SOPs, automation requirements, a formal operational baseline — and the published record of this engagement does not claim them, so neither does this page.
- Automated observation of operations across multiple remote locations, with non-intrusive desktop-recording software
- Visualized employee processes, timings, deviations and inefficiencies
- Continuous detection of deviations, wasted time and errors, broken out per group and visualized for the people who manage that group
- An accelerated process improvement strategy built on that evidence rather than on manual observation studies
The mechanism behind those artifacts is the same one described on the platform pages: work observed as performed across applications, reconstructed into process and task-level views, then turned into something an operations team can act on. Pitney Bowes is one operation it was pointed at.
Two ways to go deeper
The anonymized Medicare claims-processing analysis is the lower-friction route — full findings and method, no meeting required. The 30-Day Value Leakage Audit is the same discovery applied to a scope of your own, in a fixed period.
The customer describing what changed.
Ronnie Mahabir led North America call-centre operations at Pitney Bowes at the time of the engagement.
See what Stereologic could uncover in your operations.
Pick one back-office operation you are being asked to make cheaper or faster. We will show what a measured baseline of it contains — where the time goes, where the errors come from, and which of them is worth attacking first.