
Business Process Analysis and Improvement: Measure Before You Change
How to measure the real operation, find where value leaks, and prove whether a change worked.
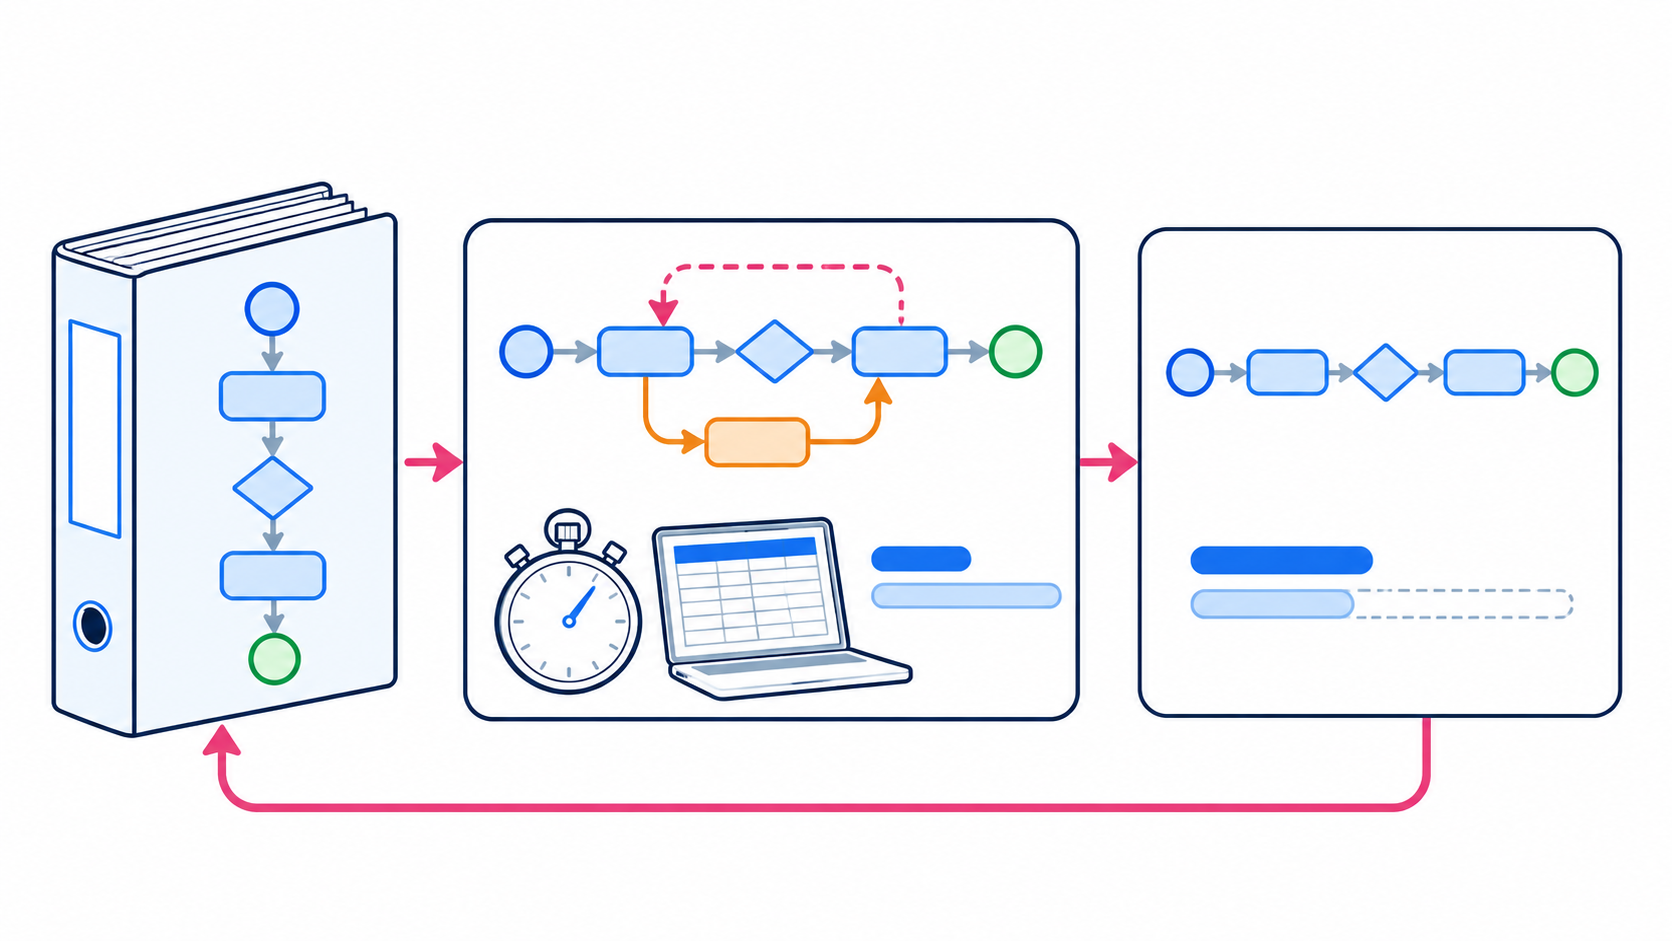
Business process analysis and improvement is the practice of measuring how a piece of work is actually performed, finding where time, effort and quality are lost, changing the process, and confirming that the change worked. Analysis is the diagnosis and improvement is the treatment. Analysis alone gives you a tidy process map. Improvement without analysis aims changes at the wrong problem.
The definition is simple, but the practice is harder in large service operations. One case crosses several applications, inboxes, spreadsheets and teams, and the documented procedure rarely matches what people do. That distance decides whether an improvement program delivers anything you can defend to an executive.
This guide explains why the practice matters, how to run it step by step, which techniques find inefficiencies and when each one fits, what it looks like in claims, lending and government work, and where analyses usually go wrong.
Why business process analysis and improvement matters
It matters because the process you have documented is rarely the process you run, and every cost, automation or AI decision rests on one of the two. Analysis tells you which one you are actually paying for.
The gap between documented and actual work
A procedure describes the intended path. Real work adds exceptions, workarounds, rework, handoffs and waiting that nobody wrote down, because they grew up around the edges of systems. Much of it happens in email, spreadsheets and manual steps outside any system of record.
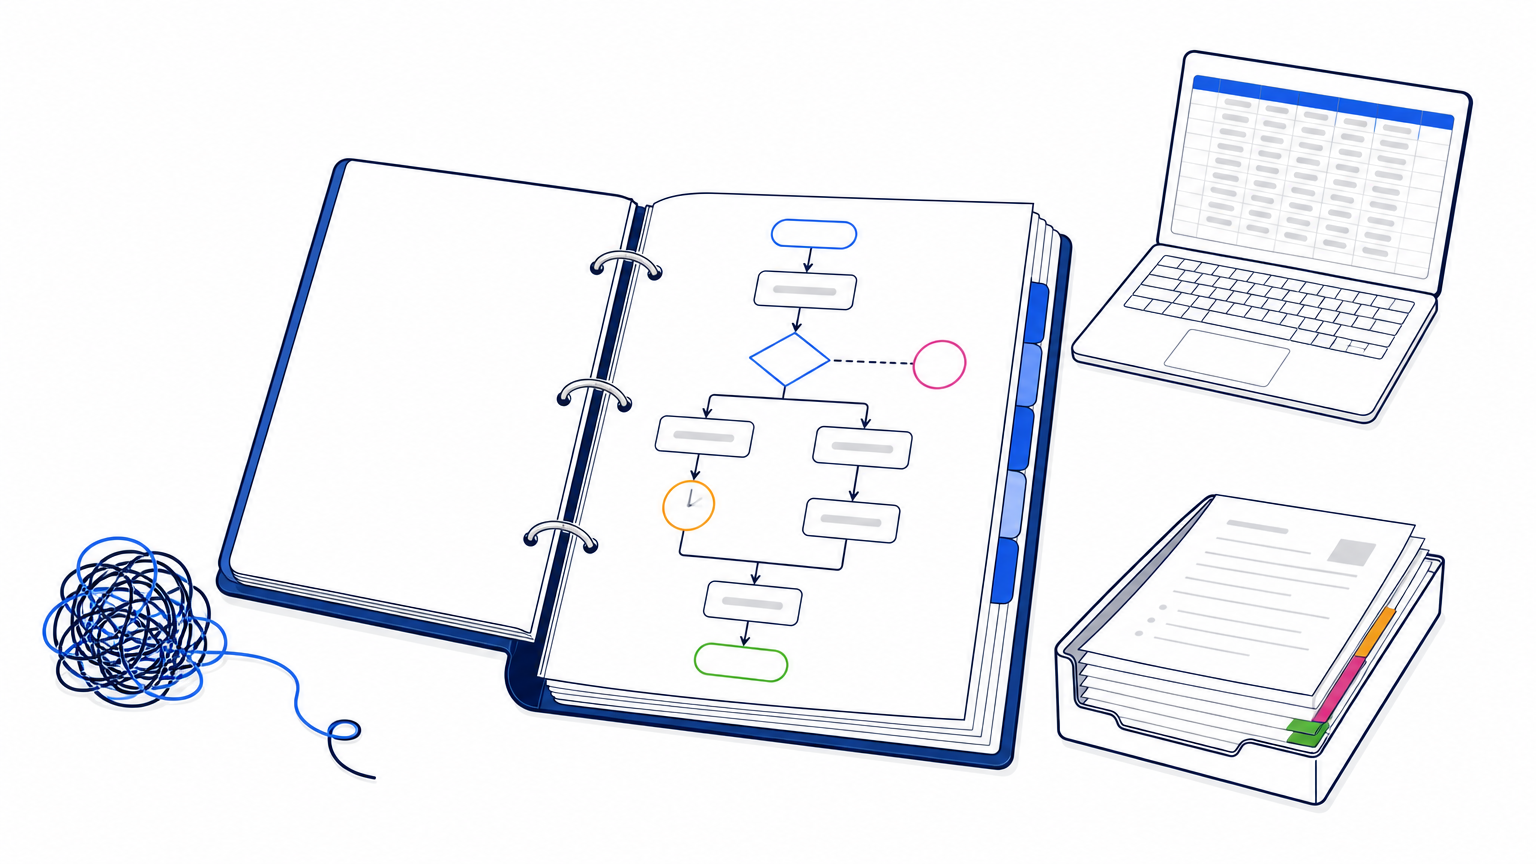
The result shows up as symptoms. Customer turnaround is long although active effort is low. Two teams do the same task in different ways. Cost climbs and nobody can say which step is responsible. Workshops rarely resolve this, because people describe the process as it should run, not as it runs.
A process you have not measured is an assumption you are paying for.
What skipping the analysis costs
Teams that jump straight to improvement tend to repeat the same few errors:
- Automating a step that only a minority of cases follow
- Automating rework instead of removing its cause
- Standardizing on a "standard" path nobody has verified is the best one
- Funding an AI initiative against a baseline that does not exist
- Settling a debate by seniority instead of evidence
The fourth error matters most to senior leaders. When a program ends, someone has to defend a number. If the before-state was never measured, the after-state proves nothing, and the business case cannot be compared with the result on the same terms.
Analysis, improvement and business analysis compared
These terms get mixed up in practice. Business process improvement analysis, a phrase some teams use, is simply the analysis phase with an improvement target attached. The table separates the four related disciplines.
| Term | Question it answers | Typical output |
|---|---|---|
| Business process analysis | How does this process really run, and where does it lose value? | Measured current state, variants, root causes |
| Business process improvement | What should change, and did it work? | Redesigned, standardized or automated process, re-measured |
| Business process management | How do we govern and monitor processes over time? | Ownership, standards, ongoing KPIs |
| Business analysis | What does the business need from a project or system? | Requirements, business cases, recommendations |
Analysis and improvement form one loop. Management keeps the loop running after the project ends. Business analysis is wider, covering strategy, requirements and systems, with process work as one input.
How to analyze and improve a business process
Choose one bounded process, measure its current state, find the causes of loss, decide what to do with each piece of work, make the change, and re-measure against the same baseline. Six steps cover it.
The six steps
Start narrow. One operational scope with a clear start and end point gives you a result. An entire department gives you a slide deck.
- Define the scope and the number to move. Pick one process and one measure, such as cost per case, elapsed time, error rate or cases per person per day. Write down the volume and the cost assumptions now, so finance agrees with them later.
- Measure the current state. Capture how work happens, not how it is described. You need time and frequency per activity, the variants cases take, and the work that happens outside systems of record. Interviews help with context, but they do not replace measurement.
- Find variation and leakage. Look for rework loops, handoffs, waiting, exceptions and differences between teams performing the same task. Separate active effort from elapsed time, because the gap between them is where customers wait.
- Identify root causes. Ask why each loss occurs. A rework loop may come from missing information at intake, a system limitation, or an unclear rule. Each cause needs a different fix.
- Decide the treatment for each piece of work. Remove it, standardize it, improve it, automate it, assist it with AI, or keep it with people. Rank the options by what they are worth in time and effort, not by who proposed them.
- Implement, then re-measure. Pilot the change, roll it out, and measure again using the same method and scope. The comparison with the baseline is your proof.
Re-measure against the same baseline, or you cannot claim the improvement.
A worked example with numbers
The figures below are illustrative, not client results. Suppose a back-office team handles 12,000 cases a month. Analysis shows that 18% need rework, and each reworked case takes 14 extra minutes. The loaded labor cost is $45 an hour.
| Input or result | Value |
|---|---|
| Cases per month | 12,000 |
| Share needing rework | 18% |
| Extra handling per reworked case | 14 minutes |
| Loaded labor cost | $45 per hour |
| Reworked cases per month | 2,160 |
| Rework hours per month | 504 |
| Rework cost per month | $22,680 |
| Rework cost per year | $272,160 |
Now the decision becomes concrete. If a root-cause fix at intake halves the rework rate to 9%, the saving is $136,080 a year. Automating the rework step would instead preserve the loss and speed up the wrong work. Only a measured baseline lets you tell the two options apart, and later prove which one you chose.
Who to involve
Name a process owner who can change the process, not only describe it. Bring in the frontline staff who perform the work, because they know the workarounds and will tell you why they exist.
Add finance to confirm cost assumptions, and IT early if the fix touches a system. Involve them before the findings, not after. People who see their own data in the analysis defend the result, and people who first meet it in an executive readout tend to dispute it.
Techniques for finding inefficiencies
Techniques fall into three groups: those that describe a process, those that diagnose its problems, and those that measure what actually happens. Use a mix, matched to the question you need answered.
Techniques compared
The table sets the common techniques side by side with what each does well and where it falls short.
| Technique | What it tells you | Best used when | Limit |
|---|---|---|---|
| Flowcharts and process maps | The intended sequence, decisions and owners | Aligning a team on a process | Shows the design, not the practice |
| Value stream mapping | Which steps add value and where work waits | Long elapsed time, low active effort | Time figures are often estimates |
| Root cause analysis (5 Whys, fishbone) | Why a specific problem occurs | You know the problem and need the cause | Depends on the quality of the facts fed in |
| Pareto analysis | Which few causes drive most of the loss | Many issues, limited capacity to fix them | Needs measured counts |
| Interviews and observation | Context, reasons and workarounds | Early scoping, validating findings | Small sample, self-reported |
| Process simulation | The effect of a change before you make it | Testing redesign options | Only as good as the baseline behind it |
| Process mining | Paths and timing reconstructed from system event logs | Work recorded in systems of record | Misses work between and outside systems |
| Task mining | What people do on the desktop across applications | Manual, cross-application work | Varies widely in depth |
Many traditional analysis methods depend partly on interviews, workshops or estimates. Process and task-level evidence can add measured data to that picture, giving teams a stronger basis for improvement decisions.
Choosing between them
Start from the question, not from the tool. Where does the work actually go? is a process-level question, and process mining answers it where usable event logs exist. What work was actually accomplished? is an activity-level question. Why does performance vary, and what is it costing? needs both views combined.
These are not interchangeable terms. Process mining shows how work moves across systems, teams and variants. Deep Task Mining™ looks inside the application at the activities and business data, so you can see what was done, to which data and against which case. Process intelligence combines both views and adds timing, variation, rework, root causes and ranked opportunities.
Pick the technique from the question you need answered, not from the tool you already own.
Examples across enterprise operations
The method is the same everywhere. What changes is where the leakage hides and which decision the analysis has to support. Claims, lending, servicing and permits show the pattern.
Where leakage tends to hide
The table lists what to look for in four common operations and the decision each analysis supports.
| Operation | Where leakage tends to hide | Decision the analysis supports |
|---|---|---|
| Healthcare payer claims | Claim subtypes routed to different manual steps, requests for missing information, handoffs between examiners | Which subtypes to standardize, which to automate, which need clinical judgment |
| Loan origination | The same applicant data re-keyed across screens, waiting on documents, differences between branches | Which steps to remove, where a stable workflow would cut rework |
| Insurance servicing and onboarding | Back-and-forth over missing documents, email and spreadsheet trackers outside the core system | Which checks to automate, which to assist with AI |
| Government permits and licenses | Applications arriving as email attachments, approval queues, status inquiries | Where to digitize intake, how to shorten waits between approvals |
In each case, the hidden work sits outside the system of record. A log from the claims platform will not show the spreadsheet an examiner uses to track pending requests. That is why analysis built only on system event logs gives a partial picture.
Turning findings into a decision
Suppose two teams perform the same task. One averages nine minutes per case and the other fourteen. The easy move is to adopt the faster method everywhere. First check that the faster team is not skipping a control or pushing errors downstream. If quality holds, standardize on the faster method and re-measure.
Some work should stay with people. A claim that needs medical judgment, or a loan exception that depends on context, is a poor candidate for full automation. Analysis earns its cost by separating those cases from the routine ones, so automation targets work that is stable and high volume.
Common mistakes and how to avoid them
Most failed analyses fail for the same reasons: the scope is too wide, the evidence is thin, or nobody measured the before-state. Each one is avoidable.
Mistakes that undermine the result
- Scoping too broadly. "Improve operations" produces a finding for every team and a result for none. Choose one process and one measure.
- Trusting the documented process. SOPs describe intent. Use them as a hypothesis to test.
- Relying on logs alone. Event logs cover the system-recorded layer and miss email, spreadsheets and manual steps.
- Automating before standardizing. If five teams do the work five ways, automation freezes the variation in place.
- Skipping the baseline. Without it, nobody can prove the improvement, and the next budget request starts from zero.
Fix causes and standardize where variation adds no value, then automate what remains.
What to ask of any measurement approach
Whatever approach you use, ask three things. Does it capture work across all the applications involved, including email and spreadsheets? Does it connect activity to cases, not just to screens? Can a person review and correct what the software recognizes?
Start with a measured baseline
Business process analysis and improvement comes down to one discipline: measure the real operation, find where value leaks, decide what to remove, standardize, automate or keep human, and then measure again on the same terms. The techniques are the means. The baseline is what makes the result defensible.
Pick one process where cost, capacity or turnaround is under pressure. Measure how it actually runs before redesigning it, then use the same baseline to determine whether the change worked.
Find out where value is leaking out of your operation.
One agreed scope, thirty days, a measured baseline and an executive readout.