
Where operational value leaks
Four lenses for finding the money before you spend money finding it.
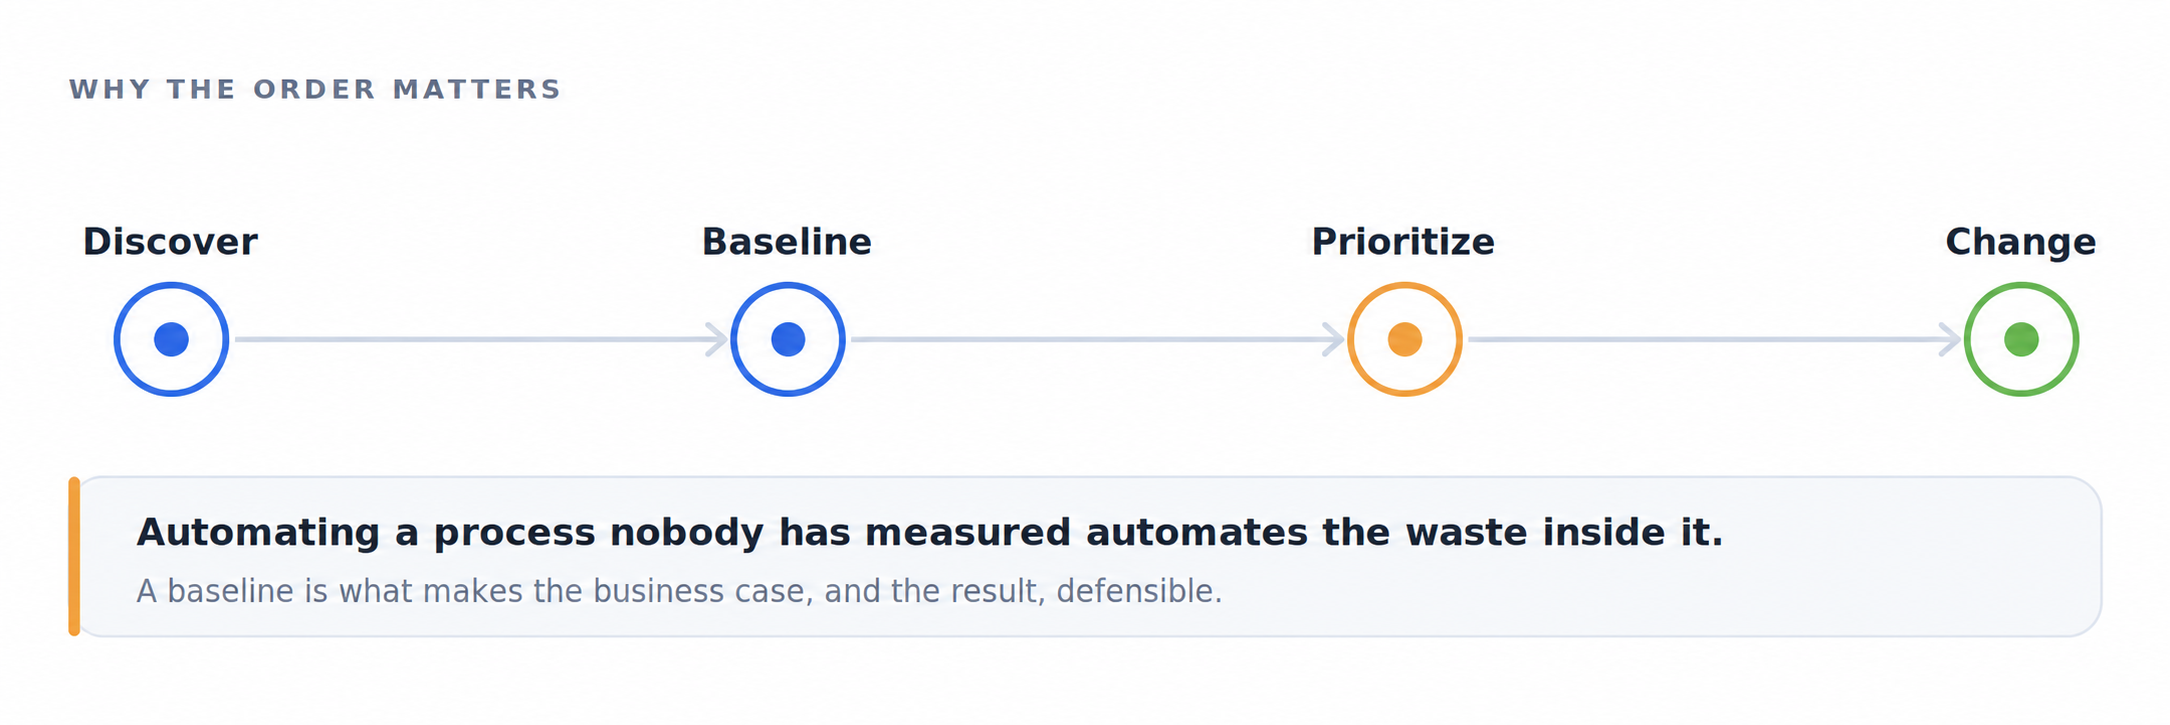
Every operations leader is asked the same question in a different form: where is the money going, and can you prove it?
The reason that question is hard to answer is not that the money is hidden. It is that it leaks in four different ways, and each one is invisible to the instrument that finds the others.
A value leakage baseline separates four categories of loss and attributes each one to specific activities, so that each has an owner and a remedy.
Lens one: Labor and capacity
This is the leak most organizations already suspect and least often quantify: effort that produces nothing the business would pay for if it were itemized on an invoice.
The same case touched by three people because the handoff carried no context.
Manual re-keying between two systems that do not talk.
Work performed at a cost point higher than the work requires.
That last one is worth dwelling on. In a Medicare claims operation at a global health insurer, measurement of the actual work identified a 69% offshore FTE savings opportunity (on active time, which was 65% of total time) and a 35% onshore opportunity, alongside modeled offshore throughput of five additional claims per hour. These were identified opportunities, not realized savings. Those are different kinds of findings: one is about where work should sit, the other about how fast it moves, and neither is visible from a headcount report.
Lens two: Process and velocity
The second leak is time, and specifically the difference between how long work takes and how long it waits. Queues between teams, approvals that sit, cases that pause mid-journey and resume days later.
Velocity leakage costs money twice. It consumes working capital in the case of anything financial, and it consumes service level in the case of anything customer-facing. It also compounds: a queue that grows faster than it drains does not produce a linear cost curve.
A queue is not a cost line. It becomes one the moment somebody attributes it.
Lens three: Technology and data friction
The third leak is the one IT is usually blamed for and rarely responsible for. It is the tax imposed by systems that were each sensible on their own and were never designed to work together.
Swivel-chair work between applications that hold overlapping data.
Spreadsheets maintained outside the system of record because the system of record does not support a real step.
Applications in daily use that nobody in IT has on the register.
Application-agnostic recording can surface applications used in the observed work that are missing from the expected IT inventory. That is a governance finding worth raising with the risk function independently of any savings case.
Lens four: Execution and quality
The fourth leak is rework, and it is the one that hides best, because a reworked case does not look like a failure in any system. It looks like a case that was touched again.
Rework consumes capacity twice, delays the customer, and in regulated work it creates exposure that has nothing to do with cost at all. It is also the leak most likely to be fixed permanently once located, because rework almost always traces back to a specific earlier step that can be changed.
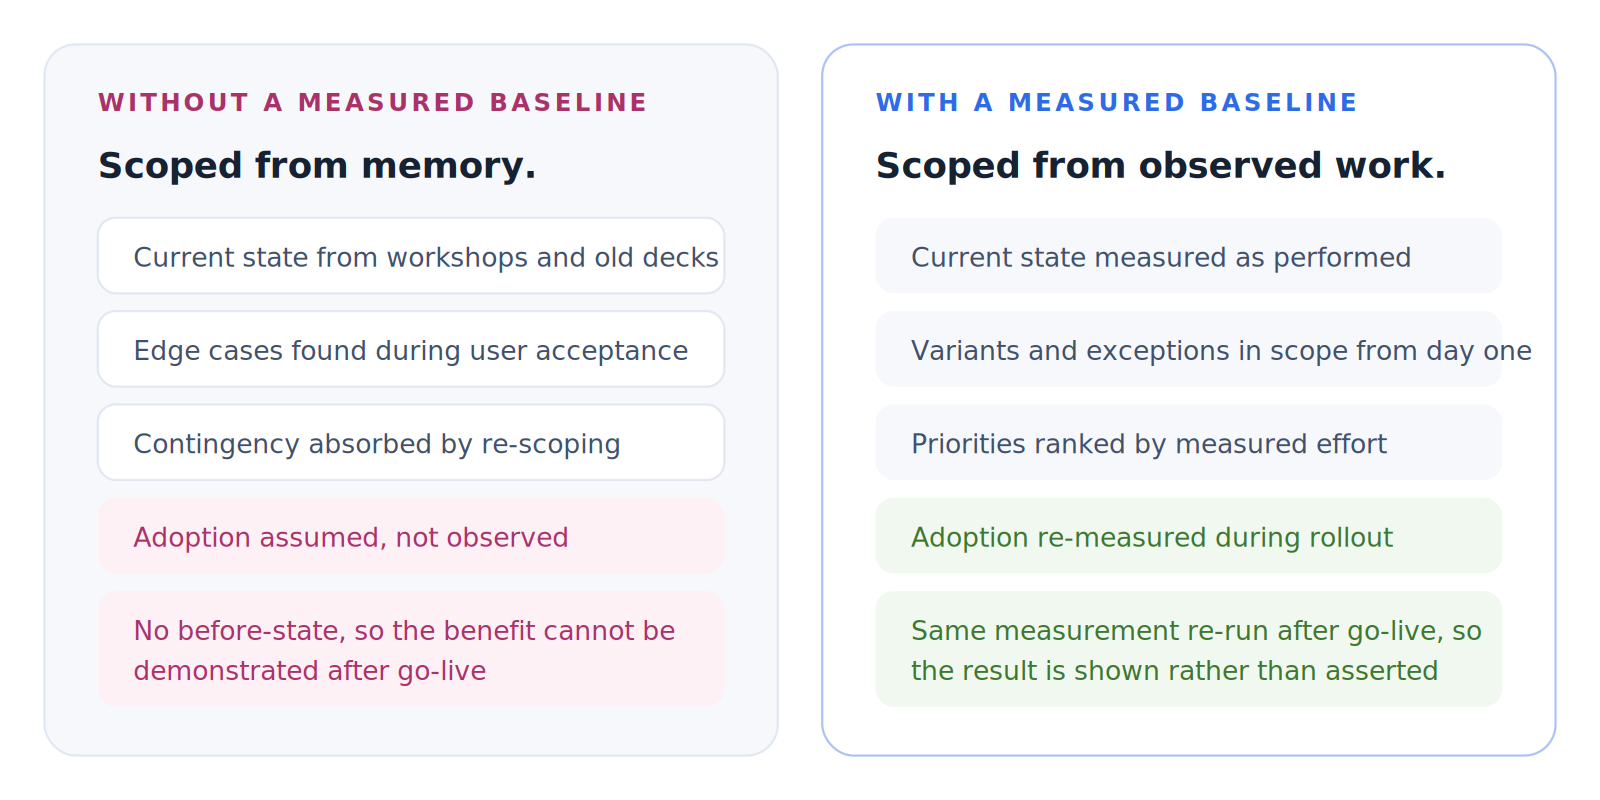
Each lens produces findings that can be attributed to specific activities and re-measured against the same baseline after a change.
Why they need to be separated
A single efficiency number is not actionable, because the four leaks have four different owners and four different remedies. Capacity leakage is an operating-model decision. Velocity leakage is a flow and queue decision. Friction is an architecture decision. Rework is a process-design decision.
Merging them produces a headline figure that nobody can act on and Finance will not accept. Separating them produces four figures that each have a name against them.
|
Lens |
What leaks |
Who typically owns the remedy |
|
Labor and capacity |
Effort spent on work the business would not pay for |
Operations leadership, operating model |
|
Process and velocity |
Elapsed time in queues, waits and approvals |
Process owners, workflow design |
|
Technology and data friction |
Manual bridging between systems and data |
Technology and architecture |
|
Execution and quality |
Capacity consumed by rework and correction |
Quality and process design |
What a defensible baseline requires
For any of the four to survive scrutiny, three conditions need to hold.
The scope is agreed in writing before measurement starts, so that nobody relitigates what was in and out afterwards.
Every figure carries its scope, its period, its method and its source, in the same sentence, not in a footnote.
The method is reproducible, so that re-measuring after a change uses the same instrument as the baseline.
Without the third condition, you cannot prove improvement. You can only assert it, and an assertion is exactly what the original question was asking you to replace.
What a completed baseline can look like
At a major Canadian bank, measurement across an agreed operational scope supported $15M in annual operational cost savings, a 22.5% acceleration of customer services, and a 95% reduction in errors and delays, diagnosed and resolved in less than six months.
The figures are attributed to specific activities within that scope and re-measurable against the same baseline. The case study is available on request.
Where this goes next
The 30-Day Value Leakage Audit applies all four lenses to one agreed operational scope and produces a value leakage number with the evidence behind it. From $50,000 USD, creditable toward a license.
Find out where value is leaking out of your operation.
One agreed scope, thirty days, a measured baseline and an executive readout.