
Business Process Mapping: Definition, Examples and Tools
Business process mapping turns a workflow into a shared view of steps, decisions, handoffs and delays. Learn the map types, symbols, examples and tools, and when a drawn map is not enough.
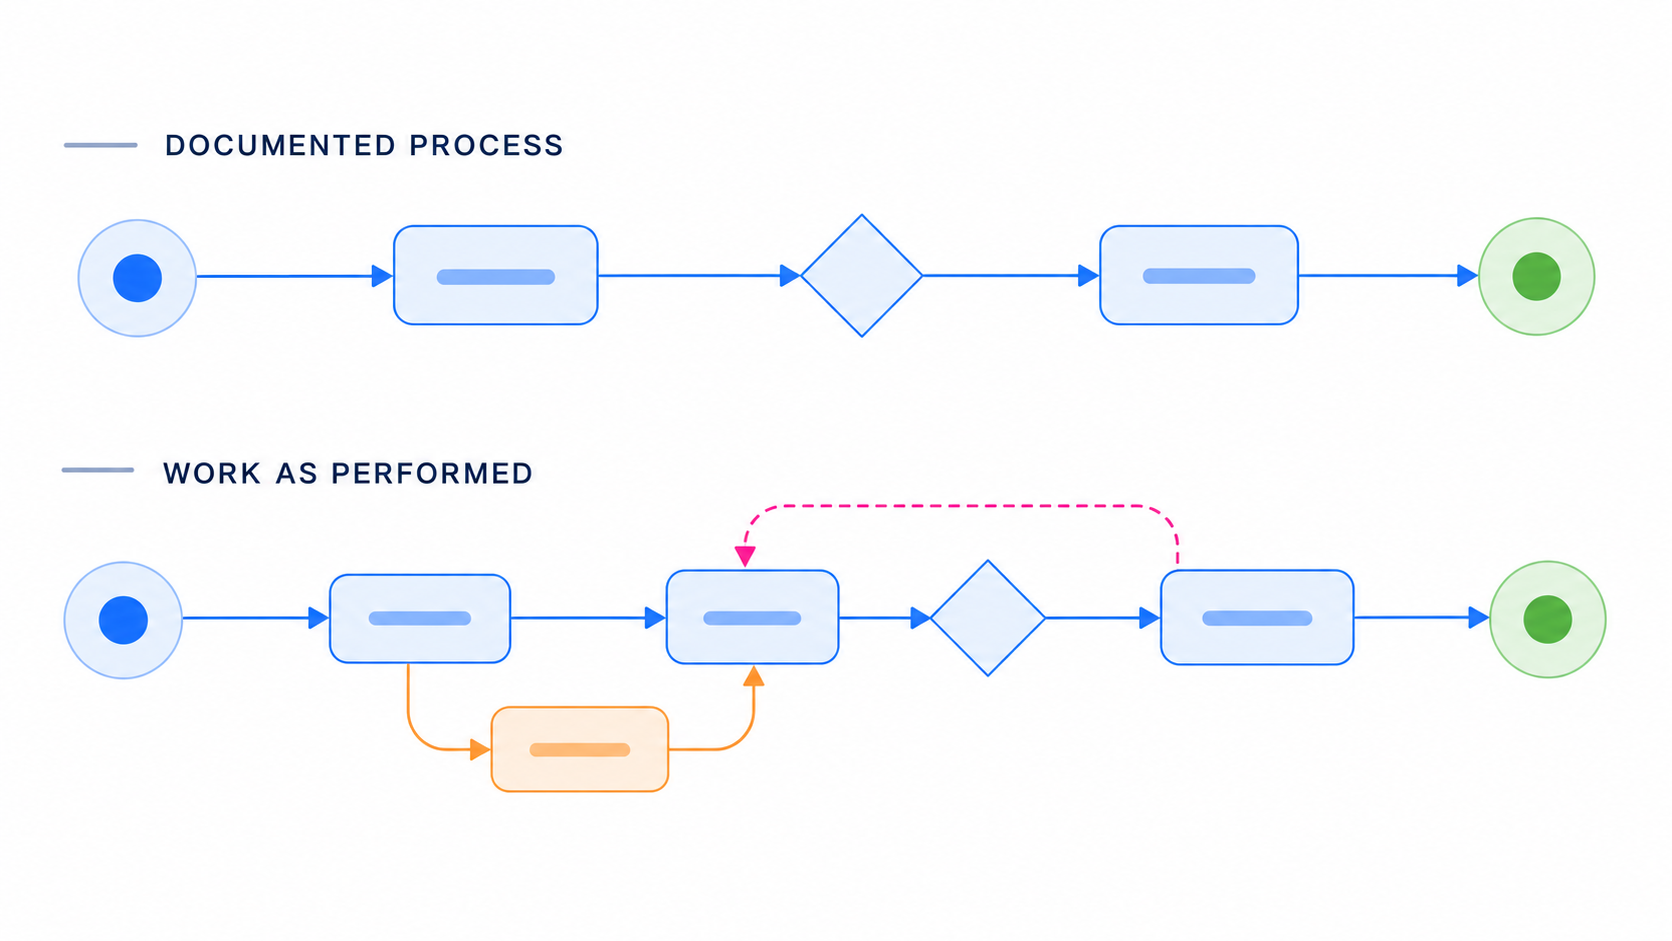
A process map can be perfectly drawn and still miss the work that matters.
Business process mapping is the practice of drawing how a piece of work moves from its trigger to its outcome. A useful map shows the steps, decisions, handoffs and owners along the way so a vague complaint such as "invoices are slow" becomes a workflow you can question, measure and improve.
This guide covers why business process mapping matters, how to map a process in eight steps, the main process map types and symbols, two worked business process mapping examples, and the tools used for different mapping needs.
The operational question underneath all of them is the same: does the map show the process as it is documented, or the work as it is actually performed? That distinction matters when the map becomes the basis for an improvement, automation or transformation decision.
Why business process mapping matters
Business process mapping gives a team a shared view of how work moves from start to finish. It can make delays, rework, unclear ownership and variation easier to discuss because everyone is looking at the same flow.
A map is also a starting point, not proof that every path has been captured. If the real operation includes exceptions, workarounds or steps outside the documented flow, those need to be validated before the map becomes the baseline for a change.
What a process map actually is
A process map is a visual record of a process: its start, its end, the activities in between, the decisions that branch the work, and the people or systems responsible.
It is different from a policy document, which describes how work should happen, and from a formal process model designed for software or governance.
A useful map is specific enough to measure and plain enough that the people doing the work recognize it.
What a map helps you find
Once the work is drawn, look for:
• Bottlenecks: steps where work queues because capacity or approval is constrained.
• Rework loops: work sent back to an earlier step because information was missing, wrong or incomplete.
• Duplicated effort: the same data entered or checked more than once.
• Unclear ownership: steps with no clear owner, or handoffs where responsibility becomes ambiguous.
• Variation: different teams handling the same type of work in different ways.
A useful process map does more than document a flow. It gives the team something concrete to validate, measure and assign before deciding what should change.
Who uses business process mapping, and when
Operations managers, business analysts, process excellence teams and transformation leaders all use business process mapping.
Common triggers include an onboarding problem, a cost or service target, a system migration, a standardization effort or an automation initiative.
In complex service operations such as healthcare, banking and insurance, the map often spans multiple teams, systems and exception paths.
Automation is one case where the accuracy of the current state matters. If the map leaves out workarounds, exceptions or rework, those conditions do not disappear simply because part of the process is automated.
A measured current state helps teams decide what to improve first.
How to map a process step by step
To map a process, choose one process, agree its boundaries, gather facts about how it really runs, draw the flow with standard symbols, add the measures that matter, and validate it with the people who do the work.
Validation is what turns a workshop drawing into a usable current-state map.
The eight steps
1. Pick one process and name it.
Define the trigger, such as an invoice arriving, and the outcome, such as the supplier being paid. Do not start with "finance".
2. Set the scope and level of detail.
Decide whether you need a ten-box overview or a task-level map. Write the start and end points down.
3. Gather the facts.
Interview the people who do the work, walk through live cases and pull any system data available.
4. List the activities.
Capture each action, who performs it, what goes in and what comes out. Ignore the order for now.
5. Draw the sequence.
Arrange the activities in order using standard symbols, with a diamond wherever the work can branch.
6. Add time and volume.
Record active time per step, waiting time between steps and how many cases pass through each month where those measures are relevant.
7. Validate with the doers.
Walk the draft through with frontline staff and ask what is missing, what is wrong and what they do that is not drawn.
8. Improve and re-measure.
Remove, merge, standardize or automate steps where appropriate, then measure again so you can compare the result with the baseline.
Map what happens, not what the manual says
A workshop often captures the process people believe should happen.
The operation itself may include the swivel-chair copy between screens, the spreadsheet kept on the side, the email to a colleague who knows how to handle an exception, or a case that comes back for correction.
There are several ways to close that gap. Interviews are quick but depend on memory. Shadowing shows real work but usually covers a limited number of cases. Observed or system evidence adds volume, timing and variation, but it still needs clear scope and validation.
The goal is not a perfect diagram. It is a current-state picture the operation recognizes as true.
| THE PROCESS ON THE WALL | Receive → Review → Approve → Complete |
| THE WORK AROUND IT | Receive → email → wait → handoff → exception → rework → approve → complete |
A process map becomes more useful when the documented flow is tested against the work that actually happens around it.
The most useful process map shows the work as it is really done, not only as it was designed.
Types of process maps and the symbols they use
There are six common types of process map, and the right one depends on the audience and the question you are trying to answer.
They draw on a small set of shared conventions, so the basics carry across most mapping tools. If
Six types and when to use each

You need only a small set of shapes to read or draw most business process maps.
Consistency matters more than decoration: use the same symbol for the same kind of work throughout the map.
 Label each decision with a question and each outgoing path with its outcome, such as "Match? Yes" and "Match? No".
Unlabeled branches make a process map harder to validate and maintain.
Use the fewest symbols that tell the story, and make every decision a labeled question.
Two business process mapping examples worked through
Business process mapping examples become more useful when time and volume are attached to the flow.
The two examples below are illustrative, not drawn from a specific client, and can be adapted to other workflows.
Example 1: supplier invoice approval
Take an accounts payable process.
An invoice arrives by email, a clerk enters it into the ERP, matches it to a purchase order, a manager approves it and payment is scheduled.
Add active time and waiting time to the map and the operating problem becomes easier to see.
 The active effort is 18 minutes, while waiting adds about 54 hours. Less than 1% of the elapsed time is active work.
The map directs attention to the long waits around approval and the payment run rather than assuming the data-entry step is the main problem.
This is the same active-time versus elapsed-time gap explored in Five minutes of work. A week of waiting.
Now add volume.
Suppose 2,000 invoices arrive each month and 30% fail the match and return to a buyer, requiring 15 minutes of additional effort each.
That is 600 invoices × 15 minutes = 9,000 minutes, or 150 hours of rework per month.
The figures are illustrative, but the method is the point: time and volume turn a mapping discussion into a measurable operational question.
Example 2: opening a bank account across three teams
Now consider a swimlane example.
Draw three lanes: the branch, the operations back office and the compliance team.
The branch captures the application and identity documents. The back office enters the data and requests a credit check. Compliance runs screening, and a decision asks "Flagged?".
If no, the account proceeds. If yes, the case returns for additional documentation.
The value of the swimlane map is the handoffs. Each lane crossing can introduce a queue, a loss of context or an ownership question.
Return arrows make rework visible. Count and validate those movements before deciding where the process needs to change.
When diagnosis is the goal, add active time, waiting time and volume to the parts of the map that matter.
That is what separates a process picture from an operational baseline.
Business process mapping tools, from whiteboards to mining
The right business process mapping tool depends on what you need to learn.
Drawing tools are useful for capturing and communicating a process. Mining and discovery tools add system or observed evidence about how work behaves.
Large operations may use more than one.
| Tool type | Best for | Main limit |
|---|---|---|
| Paper or whiteboard | First drafts and workshops | No timing data; hard to maintain |
| Diagramming software, for example Microsoft Visio, diagrams.net | Clean, shareable flowcharts and swimlanes | Depends on what people capture |
| BPMN modeling suites | Processes that will be automated or governed | Needs modeling skills and accurate input |
| Process mining | Measuring variants and delays from system event logs | Limited to activity represented in usable event data |
| Task mining | Adding evidence about work performed inside and across applications | Needs clear scope, governance and validation |
| Process Intelligence | Connecting task-level and process-level evidence into cases, paths, variants and outcomes | Depends on the quality and scope of the underlying evidence |
Start with the simplest tool that answers the question.
A short process owned by one team may only need a whiteboard and a diagramming tool.
A transformation spanning multiple teams and applications may need evidence that a workshop cannot provide on its own.
When drawing is not enough
Drawing tools cannot tell you what was never captured.
In large operations, work may move through email, spreadsheets, legacy screens and several applications, with exceptions and rework that sit outside the documented procedure or a single system record.
This is where Stereologic’s Deep Task Mining™ fits.
It connects observed activity inside and across applications to the business work being accomplished, including decisions, interruptions, variants, handoffs and outcomes.
Those activities can be reconstructed into cases and end-to-end processes.
Combined with process-level evidence, Process Intelligence can show how the standard path and its variations actually behave.
The purpose is practical: to give teams enough evidence about the current operation to decide what should happen next.
Use drawing tools to describe a process. Add measured evidence when the decision depends on how the process actually behaves.
Where to start with your own process map
Business process mapping has a practical purpose: create a shared view of the work, validate it, add the measures that matter and use the result to decide what to investigate or change.
Pick one process, set its boundaries and start at the level of detail your question requires.
Then test the map against reality.
If the operation is large, spans many applications or contains significant exceptions and rework, a workshop may be only the first layer of the current state.
If you need a measured baseline for one operational area before deciding what to improve, automate or transform, the 30-Day Value Leakage Audit provides a defined starting point.
Stereologic agrees the scope and metric, maps how the work is actually performed, quantifies value leakage using the customer’s own assumptions, and creates a baseline for what to address next.
Find out where value is leaking out of your operation.
One agreed scope, thirty days, a measured baseline and an executive readout.